Health Matura project · 2022 – 2024
Replacing a paper chart for people who run out of energy.
People with chronic fatigue often track their energy on paper to plan their day and avoid crashing. Fatigue Diary makes that a quick log after each activity, and then shows which activities give energy and which use it up.
- role
- Solo: research, design, code
- timeline
- Jan 2022 – 2024
- stack
- Next.js, React, MySQL, Tailwind (v1: PHP)
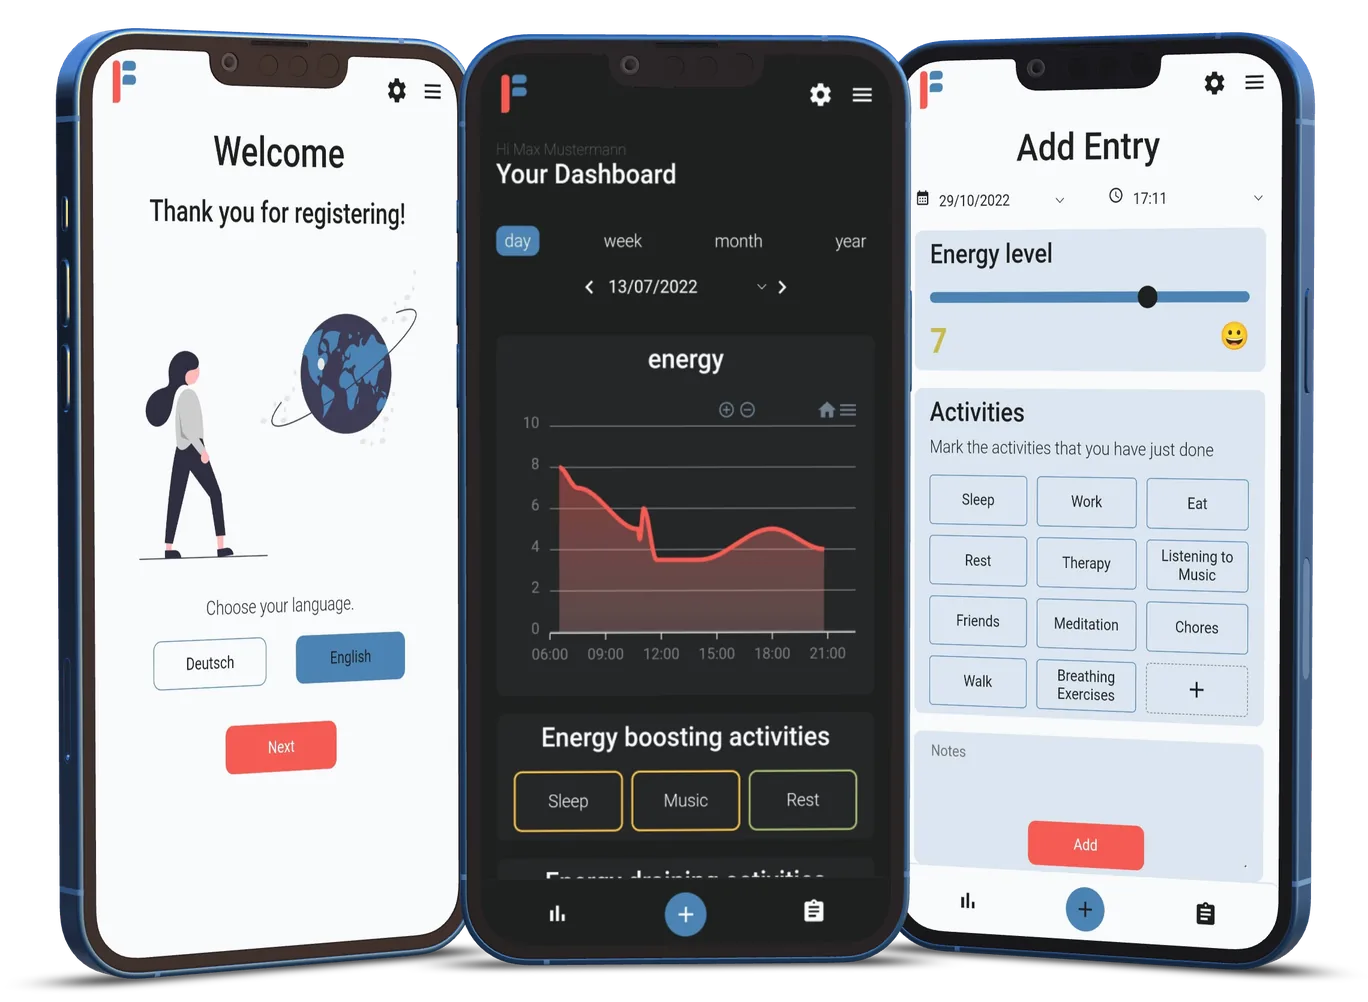
v1 (2022): onboarding, the energy dashboard, and logging an entry.
01Problem
For people with ME/CFS, MS or Long COVID, doing too much can mean a crash that lasts for days. Therapists teach pacing: keep track of your energy, notice what drains it, and plan rest before you need it. In practice, that tracking usually happens on a paper chart.
Can a web app make energy tracking easier than the paper chart it replaces?
That was the research question for my Matura project. The bar was set by paper, which is always at hand and has nothing to set up. For someone who is already exhausted, every extra tap matters.
02Design
The core loop is one screen: set your energy from 0 to 10, tap the activities you just did, and save. Everything else is built from those entries.
Log after each activity
An entry is a slider and a few buttons, not a form. Activities are tappable chips, and you can add your own.
Zoom from a day to a year
Energy charts by day, week, month and year, with a date and range picker. You can see patterns paper never shows.
Let the data rate activities
The app works out which activities tend to raise or lower energy, so you don't have to read your own charts.
Calm by default
Light and dark themes, low visual noise, German and English, and video instructions instead of a long text manual.
03Activity rating
The most useful feature turned out to be a simple calculation. For each entry, the app takes the change in energy since the previous entry and gives it to the activities logged with it. Each activity's average change then decides whether it counts as boosting or draining. The colour shows how strongly, compared to your best and worst activity.
Illustration with made-up numbers. In the app the averages come from your own entries.
04Rebuild
Version 1 was plain HTML, CSS and JavaScript on PHP and MySQL, with a guided tour for new users. It answered the research question. But adding features kept getting harder, so in 2024 I rewrote it from scratch.
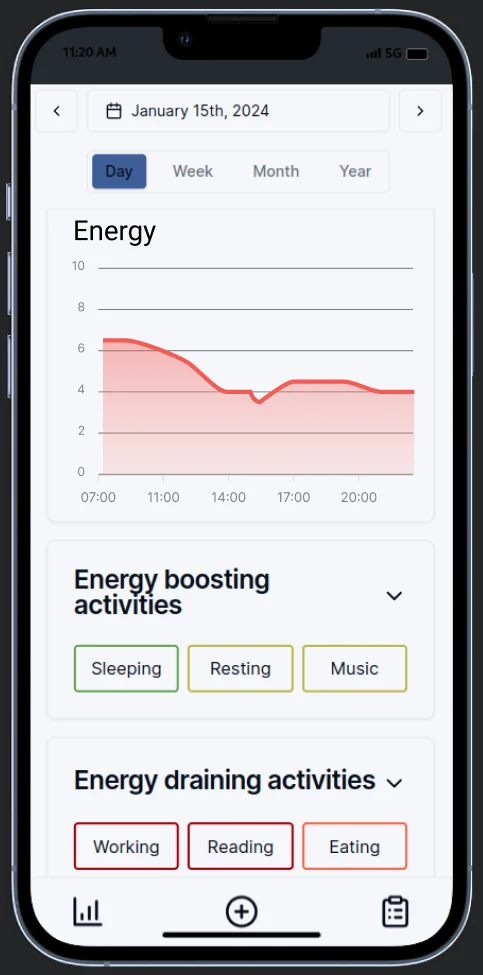
v2 (2024): same core loop, rebuilt with Next.js 14 and shadcn/ui. Activity borders are coloured by how strongly each one boosts or drains.
- v2.0: Next.js 14, React, NextAuth, ApexCharts and shadcn/ui. Entries can now be edited and deleted, data export is simpler, and video instructions replace the guided tour.
- v2.1: users can track any health metric (symptoms, medication, treatments, measurements) and build their own charts to compare them with energy.
- Installable as a PWA, with home-screen shortcuts that jump straight to a new entry.
05Outcome
I tested it with about 15 therapists, who my own therapist introduced me to, and about as many patients who found it through social media. Their feedback and my own use pointed the same way: logging in the app was quicker and more useful than the paper chart. That's mostly because the analysis does work people would otherwise do in their heads.
It was my first project with real users, and over 500 people have signed up since. What I learned: put the least possible friction into the one thing people do every day, and put the effort into what the app does with it afterwards.